Just 21% of Americans say the country is heading in the right direction, while 74% say it is on the wrong track, according to the latest national polling average. The 53-point gap between optimism and pessimism is among the widest recorded in modern American political history — and it arrives exactly 17 months before the 2026 midterm elections.
What the Numbers Show
The right track/wrong track question has been asked in nearly every major American poll since the 1970s. It serves as a broad proxy for national sentiment — capturing economic anxiety, trust in government, and satisfaction with the direction set by the party in power.
The current reading of 21% right track / 74% wrong track means that for every American who thinks things are going well, nearly four say they are not. That ratio — approximately 1:3.5 — is historically unusual and structurally dangerous for the incumbent party heading into a midterm cycle.
Right-track numbers consistently below 25% are associated with what political scientists call "wave election" conditions — environments in which structural headwinds overwhelm candidate quality and local fundamentals, producing lopsided national results.
Historical Context: How Rare Is 74% Wrong Track?
Wrong-track readings of 74% or higher are rare in American polling history. The three most comparable midterm environments produced some of the largest seat swings of the modern era:
| Year | Wrong Track % | President Approval | House Seat Change |
|---|---|---|---|
| 2006 | 61% | 37% (Bush) | D+31 |
| 2010 | 62% | 44% (Obama) | R+63 |
| 2018 | 66% | 41% (Trump) | D+41 |
| 2022 | 70% | 41% (Biden) | R+9 |
| 2026 (current) | 74% | 39.4% (Trump) | D+25-35 projected |
The 2022 comparison is instructive. Despite a 70% wrong-track reading, Republicans gained only 9 seats because wrong-track sentiment was more evenly distributed across party lines — driven in part by inflation that was seen as a global phenomenon beyond partisan control. The 2026 dynamics differ: the wrong-track sentiment is more sharply partisan, with independents overwhelmingly blaming Republican governance.
Who Is Driving the Wrong-Track Surge?
The 74% wrong-track figure is not monolithic — it is driven by distinct voter segments with different underlying concerns:
- Independent voters: Approximately 78% wrong track. Independents, who constitute roughly 41% of the electorate, are the decisive swing bloc. Their lopsided wrong-track reading is driven primarily by economic anxiety — tariff-driven price increases, housing costs, and uncertainty about Medicaid coverage.
- College-educated suburbanites: 80% wrong track. This group, which shifted significantly toward Democrats in 2018 and 2020, has not returned to Republican positions. Concerns center on institutional stability, healthcare, and education funding.
- Voters earning $50,000-$100,000: 72% wrong track. This middle-income band is particularly sensitive to consumer price changes from tariffs and sees fewer financial buffers against economic shocks.
- Republicans and Republican-leaners: Approximately 28% wrong track — an unusually high figure within the president's coalition, driven by specific policy objections including the Medicaid cuts in the budget reconciliation bill and deficit concerns among fiscal conservatives.
What Right-Track/Wrong-Track Means for House Control
The Generic Congressional Ballot currently stands at D+7.0 — Democrats leading by 7.0 points nationally. The combination of a deeply negative right-track/wrong-track reading and a D+7.0 generic ballot is structurally consistent with Democratic House gains in the range of 25-40 seats.
Republicans hold a 222-213 House majority as of July 2026, meaning Democrats need a net gain of just 5 seats for a majority. In historical context, a president with 39.4% job approval and a 74% wrong-track reading has never survived a midterm election without double-digit House losses. The closest parallel — 2006 and 2018 — both produced Democratic gains exceeding 30 seats.
However, structural factors complicate the translation of mood into seats. Republican gerrymandering advantages established after the 2020 census mean Democrats typically need D+5 or better on the generic ballot just to break even on seats. At D+7.0, they are above that threshold — but the map still advantages Republicans in ways that could compress Democratic gains below what the national mood alone would predict.
The Senate Outlook
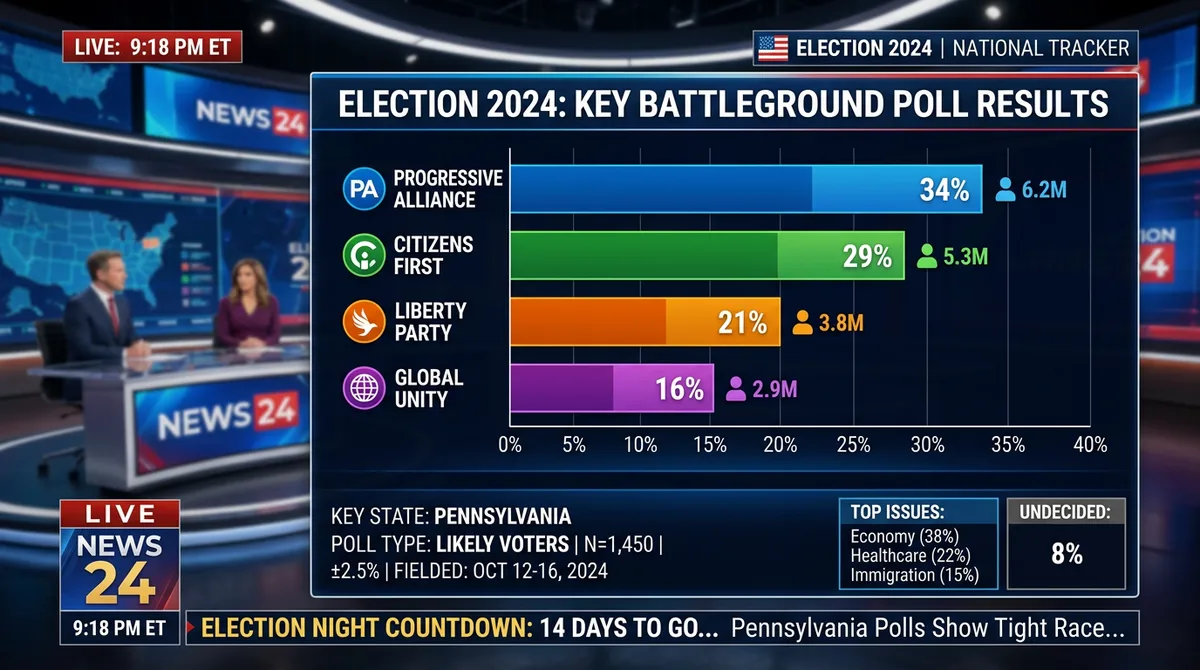
On the Senate side, the 74% wrong-track environment is most consequential in the four toss-up states: Georgia, Pennsylvania, Wisconsin, and Maine. In all four, wrong-track sentiment among likely voters exceeds 70%, with particular intensity around economic issues in Pennsylvania and Wisconsin.
Democrats currently hold 47 Senate seats and need a net gain of 3 to reach a functional majority. The Senate tracker shows Democratic opportunities in all four toss-up states, with the path to majority running through Wisconsin and Pennsylvania as the highest-probability flips given the wrong-track environment.
The Key Variable: Turnout
National mood and generic ballot figures translate into electoral outcomes only if voters turn out. Midterm elections consistently produce lower turnout than presidential years — and that drop is not uniform across partisan lines. In 2022, the anticipated "red wave" failed partly because Democratic base turnout, particularly among young women energized by the Dobbs abortion decision, remained elevated despite the wrong-track environment.
For 2026, the question is whether the 74% wrong-track figure translates into comparable Democratic base enthusiasm. Early indicators from special elections and party registration data suggest Democratic enthusiasm is elevated, but the 17 months between now and November 2026 provide substantial room for sentiment to shift in either direction.