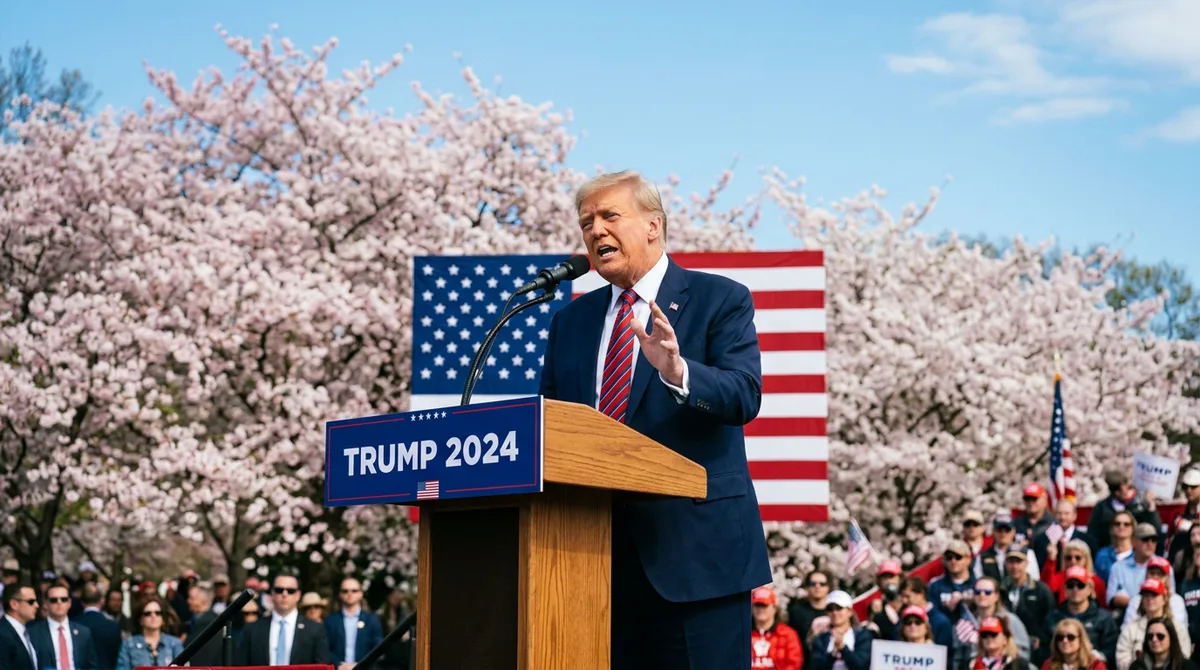

Video Analysis
CBS News tracks how Trump second-term economic performance is reflected in approval polls — and how economic sentiment is driving 2026 midterm dynamics.
Research & Data
- GDP grew +2.0% in Q1 2026 (BEA advance estimate) — but PCE inflation hit 4.5%, the highest in two years, raising stagflation concerns; economists put recession probability at 35-45% for 2026
- Inflation rose to 3.8% (up from 2.9% at inauguration), with economists attributing ~0.5-0.8 percentage points directly to tariff pass-through costs
- The S&P 500 is down 15% from Inauguration Day 2025 — erasing the entire post-election market rally that had accompanied Trump's return to office
- Chinese tariffs above 100% drove a 34% decline in US soybean exports to China in 2025 — agricultural communities in Great Lakes swing states are among the hardest hit
- Trump's first term (pre-COVID) averaged 2.5% GDP growth with 3.5% unemployment; the second term has opened with stagflation dynamics (GDP +2.0% but PCE 4.5%) — a fundamentally different economic environment
15-Month Economic Scorecard

Key Economic Indicators: January 2025 – April 2026
GDP growth (quarterly annualized %), inflation (CPI year-over-year %), and unemployment rate (%) tracked from Trump’s inauguration through Q1 2026.
Sources: Bureau of Economic Analysis, Bureau of Labor Statistics, Federal Reserve. Q1 2026 GDP is advance estimate.
What Happened to the Economy?
Trump entered his second term in January 2025 inheriting a softly landing economy: inflation had declined from its 2022 peak of 9.1% to 2.9%, the Federal Reserve had begun cutting rates, and unemployment was at 4.1% — historically low. The early economic picture looked manageable.
The pivot point came in spring 2025, when the administration announced sweeping new tariffs: baseline 10-25% duties on imports from most trading partners, and escalating tariffs on Chinese goods reaching above 100% on key categories. Trading partners retaliated. Business investment paused. Consumers began front-loading purchases ahead of anticipated price increases — temporarily inflating Q4 2025 GDP figures — then pulled back sharply in Q1 2026.
By April 2026, the economic picture had deteriorated on nearly every metric that voters feel directly: groceries, housing, stock portfolios, and job security. Consumer confidence hit levels last seen during the 2011 debt-ceiling crisis — a period widely remembered as politically toxic for the governing party.
Tariffs: The Defining Economic Variable
Economists across the ideological spectrum have identified tariff policy as the primary driver of the economic deterioration. The mechanism is straightforward: import duties raise costs for American businesses that rely on foreign inputs, and for American consumers who buy foreign-made goods. Those costs flow through to inflation.
| Tariff Category | Rate | Consumer Impact |
|---|---|---|
| Chinese goods (electronics, appliances) | 54–145% | Avg. +$800/yr per household on electronics |
| Steel & aluminum (global) | 25% | Auto prices up ~$3,000; construction costs elevated |
| All other imports (baseline) | 10–25% | Clothing, footwear, household goods up 8–18% |
| Agricultural retaliation (inbound) | China: 34% on US ag | Soybean exports to China down ~34%; farm income pressure |
| EU goods (bilateral escalation) | 20% | Wine, machinery, pharmaceuticals affected |
Polling data: 67% of Americans say tariffs have hurt their family financially. Only 24% believe tariffs will help the US economy in the long run (Reuters/Ipsos, March 2026).
Second Term vs. First Term: The Numbers
| Metric | First Term (15 mo.) | Second Term (15 mo.) | Change |
|---|---|---|---|
| GDP Growth (avg quarterly) | +2.6% | −0.3% | −2.9pts |
| Inflation (15-month mark) | 2.1% | 3.8% | +1.7pts |
| Unemployment | 4.1% (down from 4.7%) | 4.4% (up from 4.1%) | Reversed trend |
| S&P 500 performance | +18% | −15% | −33pts |
| Consumer confidence | Rising (96 → 101) | Falling (71 → 57) | Reversed trend |
| Economic approval (Gallup) | 46% | 37% | −9pts |
First-term data excludes the COVID-19 shock period (Q1–Q2 2020) for comparability. Sources: BEA, BLS, Gallup, S&P Global.
Where Americans Feel the Pain Most
| Category | Change Since Jan 2025 | % Voters Citing as Top Concern |
|---|---|---|
| Groceries & food prices | +9.4% | 78% |
| Housing costs / mortgage rates | 7.2% rate (unchanged) | 64% |
| Auto prices (tariff effect) | +$2,500–4,000 on new cars | 52% |
| Credit card interest rates | Average 22.1% APR | 47% |
| Gasoline | +18% vs Jan 2025 | 61% |
| Utility bills / energy | +11% | 44% |
What Independents Think — The Most Important Shift
Among partisan groups, independent voters have moved the most sharply against Trump’s economic performance. In January 2025, independents gave Trump a net +3 rating on economic approval. By April 2026, that figure had fallen to −16 — a 19-point swing that mirrors the broader deterioration in consumer confidence among non-partisan voters.
(down from 78% Jan 2025)
−19 pts since inauguration
(structural opposition)
Why it matters: Independent voters are the decisive bloc in competitive 2026 House and Senate races. A 19-point swing in economic approval among independents — if it holds through November — would translate directly into the suburban seat losses that flip chamber control.
Related
Tariffs & the Polls
How the tariff program is polling and why it matters for November.
Trump Economic Approval 2026
Only 37% approve of Trump's handling of the economy. What Gallup and Quinnipiac show.
Consumer Confidence 2026
The UMich index at 57: what it predicts for the midterms.





